Building and Benchmarking No-Code Chemoinformatic Machine Learning Models with Prithvi
Deep Forest Sciences
Aryan Amit Barsainyan, Bharath Ramsundar
02.13.2024
Building quantitative structure activity relationship (QSAR) models that predict molecular properties is an important task for a small-molecule biotech/pharma company. Robust models that predict properties such as solubility, lipophilicity, and other ADME/Tox measurements can be valuable tools in the design process for new small molecules. In this blog post, we discuss how the Prithvi platform facilitates building and benchmarking chemoinformatic models. In particular, we build predictive models on some datasets from the MoleculeNet benchmark collection.
A Brief Introduction to Prithvi
Prithvi is our AI-powered platform to accelerate small molecule drug discovery with scientific foundation models. It has the ability to
- Perform structural analysis of targets and identify potential binding sites for a more targeted design process.
- Build models based on early assay or patent data to use in large scale virtual screens.
- Construct active learning pipelines to identify and confirm high quality hits.
- Suggest modifications to increase the potency, selectivity and safety of hits.
To learn more about Prithvi, check out our earlier blog post. In this post, we will focus on using Prithvi for ligand-based chemical machine learning, but in future posts we will highlight Prithvi’s capabilities in structure-based drug discovery and design as well.
A Brief Overview of MoleculeNet
MoleculeNet is a widely used benchmark for molecular machine learning tasks (co-created by our CEO Dr. Ramsundar during his Ph.D. at Stanford), which focuses on molecular machine learning and is integrated with DeepChem. Predicting the aqueous solubility of a compound or ESOL (Estimated SOLubility) directly from its structure is one task benchmarked in MoleculeNet through the Delaney dataset. Delaney (also referred to as ESOL) is a regression dataset containing structures and aqueous solubility data for 1128 compounds.
The MoleculeNet paper reported an RMSE score of 1.7406 ± 0.0261 (mol/L) on the Delaney (ESOL) dataset for Random Forest (RF) Regression models and RMSE score of 0.8851 +- 0.0292 (mol/L) on the Delaney (ESOL) dataset for Graph Convolutional Network (GCN), each on a 80:10:10 scaffold split. This performance is based on the average results from three models trained with hyperparameters obtained through grid search-based hyperparameter tuning. This same analysis workflow can be easily replicated through Prithvi.
Benchmarking in Prithvi
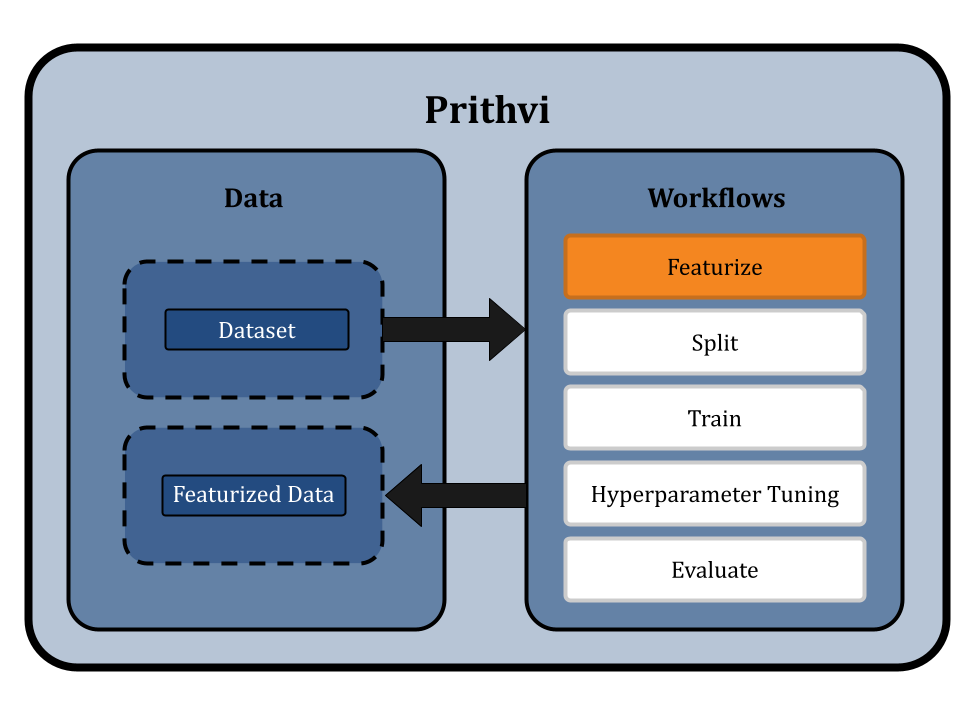
We start by uploading the Delaney dataset to Prithvi and then perform the following analysis steps
- Featurizing the dataset
- Splitting the dataset using scaffold split
- Hyperparameter tuning to get parameters for RF and GCN
- Training three models using the parameters for RF and GCN
- Evaluate all 3 models on training, validation and test splits for RF and GCN
Let's discuss each step in detail.
Featurizing the Dataset
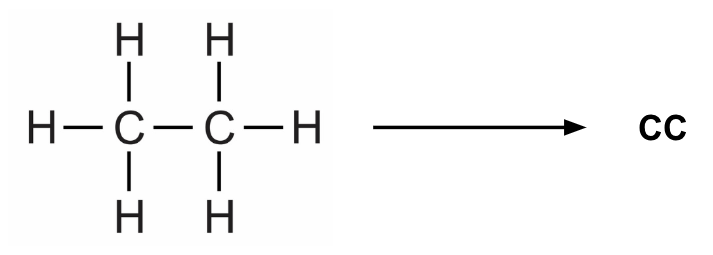
Prithvi provides a Featurize workflow which extracts atom-, bond- and molecule-level features from the SMILES strings in the dataset. SMILES (Simplified molecular-input line-entry system) is a line notation method to represent molecules as well as reactions. For example, we can represent ethane as follows:
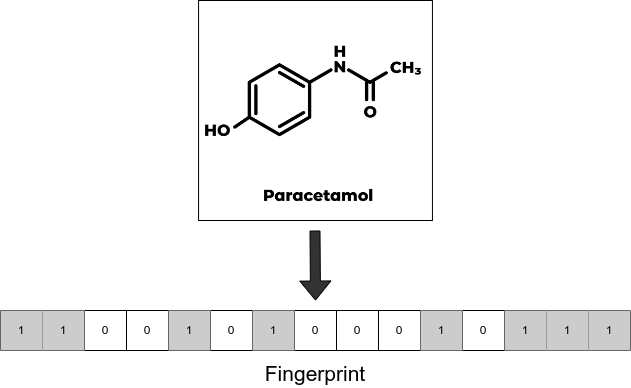
We use extended connectivity fingerprints (ECFP) for the random forest models. During the ECFP featurization process, local structural properties of the molecule are represented as a fixed-length binary array whose each element is either 1 or 0.
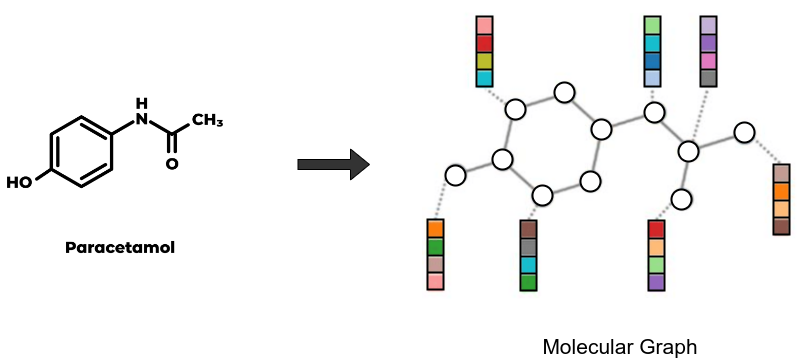
Since graph models like GCN take molecular graphs as input, we use a custom featurizer which converts SMILES into graph structures where nodes and edges contain atom and bond features respectively.
In this workflow, we can use our no-code UI to run the featurization process. We first specify the dataset to be featurized, in our case Delaney. Then we select the ECFP (circular/morgan fingerprint) featurizer and add custom parameters like 1024-bit size and 2 radius. We name the output featurized dataset as “feat_delaney_ecfp”. Similarly for GCN, we select our graph featurizer ‘MolGraphConv’, and store the output as “feat_delaney_fgcn”. Prithvi supports working with compute nodes of various specifications. We will choose a small node (vCPU - 4, RAM - 8 GB) to run this workflow since the dataset is small.
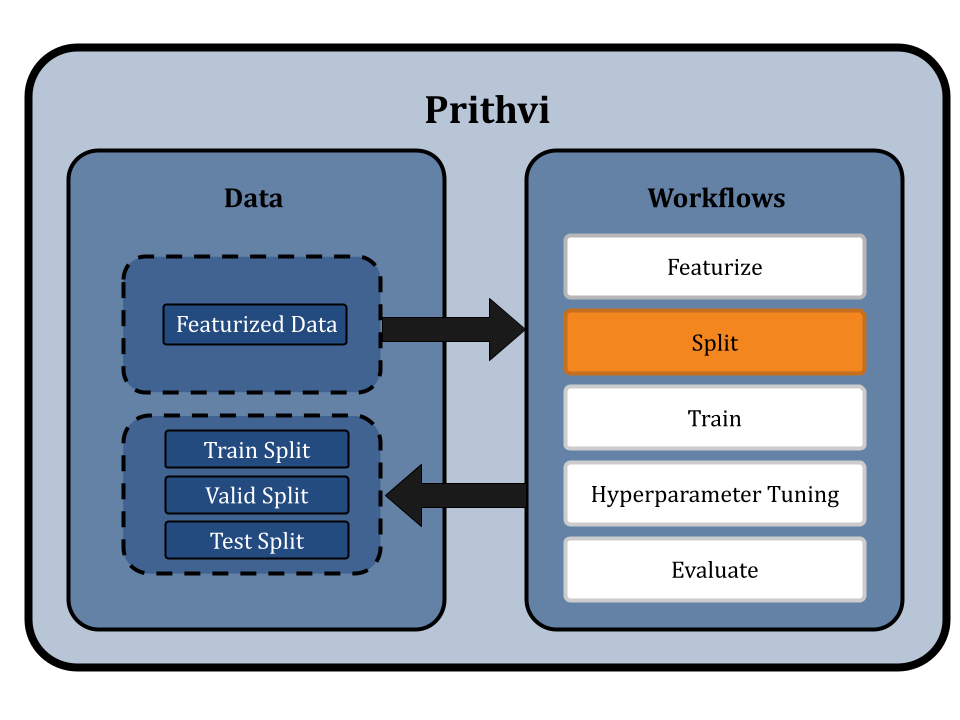
Splitting the Dataset using Scaffold Splits
Prithvi provides a Split workflow which splits datasets into for train, valid and test splits. Different splitting algorithms like random splitting, scaffold splitting, and others are supported.
We specify the featurized dataset “feat_delaney_ecfp” or “feat_delaney_fgcn” as our input and select the Scaffold split option on the no-code UI. In scaffold splitting, the data is split into train and test sets such that the molecular scaffolds in each group are as distant from the other as possible. The result is that every single molecule in the test set has a scaffold unique from the train set, and is molecularly distant from the train set. Ensuring the test set is maximally distant from the training set helps test models for generalizability and provides a better measure of its performance on new molecules proposed in a drug discovery campaign.
The default split ratio is 80:10:10. We get train, valid and test dataset splits as output from this workflow.
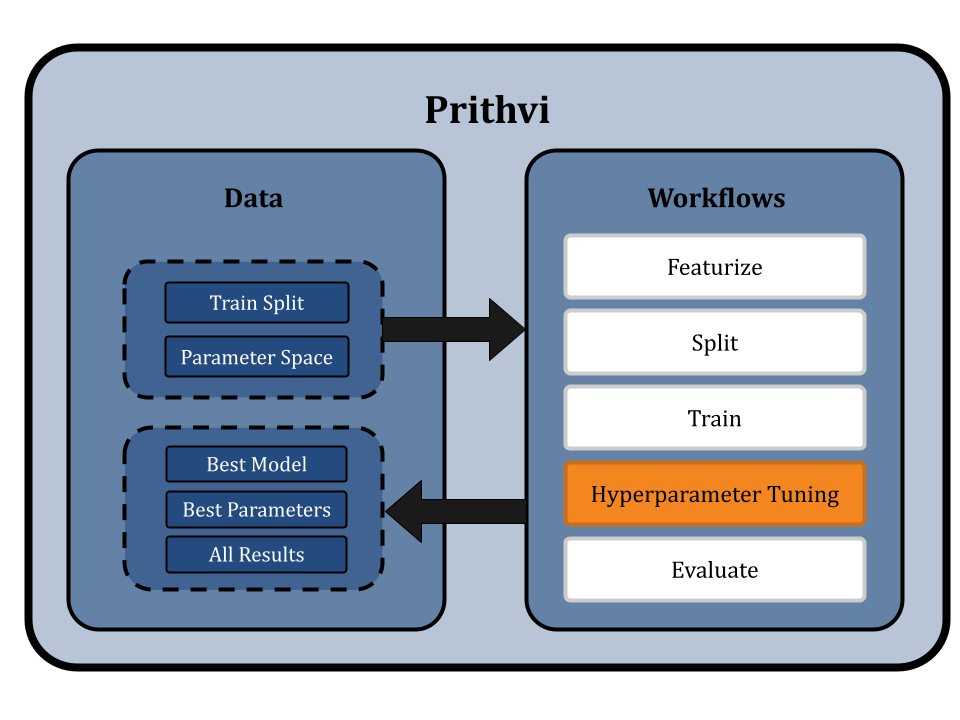
Hyperparameters Tuning for Parameters for RF and GCNs
Now we use the Hyperparameter Tuning workflow of Prithvi to test parameters across a specified hyperparameter search space. For simplicity, we will use a parameter grid, and run all the possible combinations to find the best model parameters to use based on a specified metric.
We select the random forest regressor model and define the hyperparameter space as follows:
- n_estimators: [10, 30, 100]
- min_samples_split: [2, 4, 8, 16, 32]
- bootstrap: [True, False]
- criterion: ["mse", "mae"]
Similarly, we select the graph convolutional network model and the train split. We define the hyperparameter space as follows:
- learning_rate: [1e-4, 1e-3, 1e-2, 1e-1]
- predictor_hidden_feats: [32, 64, 128, 256, 512]
- residual: [True, False]
- batchnorm: [True, False]
- dropout: [0.0, 0.1, 0.2, 0.3, 0.4, 0.5, 0.6]
- predictor_dropout: [0.0, 0.1, 0.2, 0.3, 0.4, 0.5, 0.6]
We select the RMSE metric for tuning and choose a GPU node (vCPU - 4, RAM - 8 GB, GPU - 1) for tuning. Then we run hyperparameter search jobs for both the models.
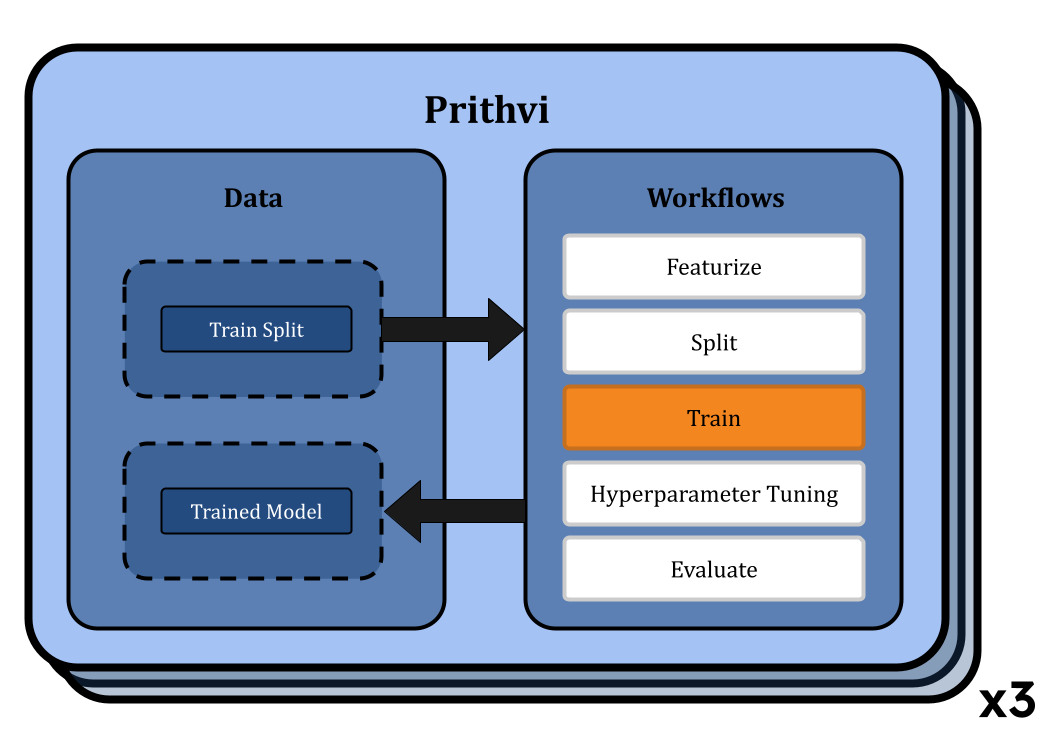
Training Models using Selected Hyperparameters
We use the Train workflow to train models on specific parameters. Prithvi allows users to start multiple jobs through a single workflow. For each job, we choose the random forest regressor model or graph convolutional network model and the train split along with the best parameters from the Hyperparameter Tuning workflow. We run each training workflow on a GPU node (vCPU - 4, RAM - 8 GB, GPU - 1).
Evaluating Models on Train/Valid/Test splits for RFs and GCNs
Next we use the Evaluate workflow of Prithvi to evaluate the model performance on specified datasets and metrics. After our models for each model type are trained, we evaluate models using the RMSE metric on the training, validation, and test splits. Here, again we submit multiple workflow jobs, one for each model. The evaluated results are stored in json files. These files can be downloaded locally for later use.
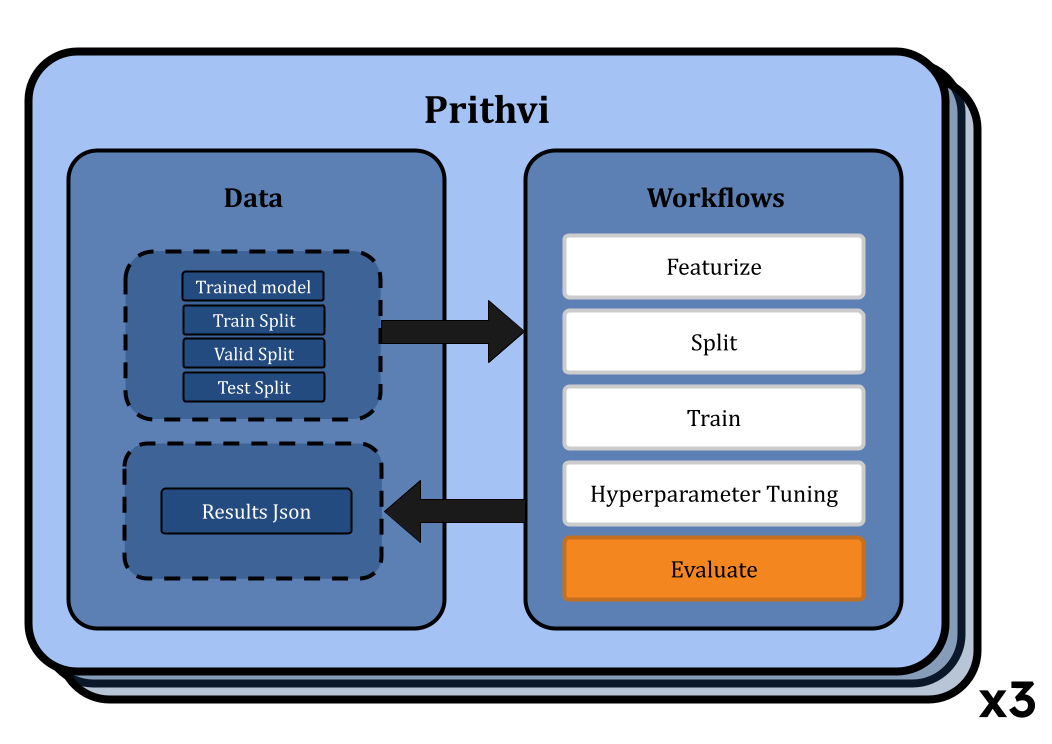
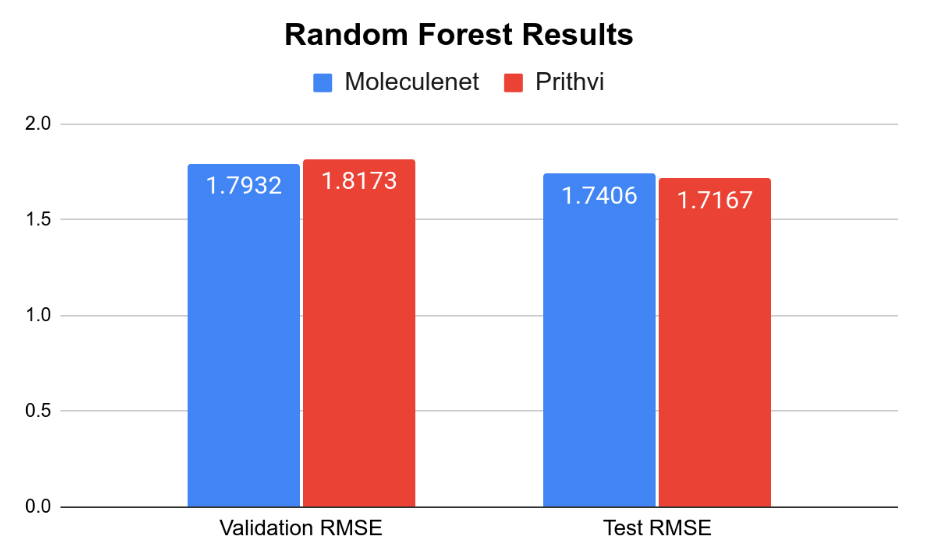
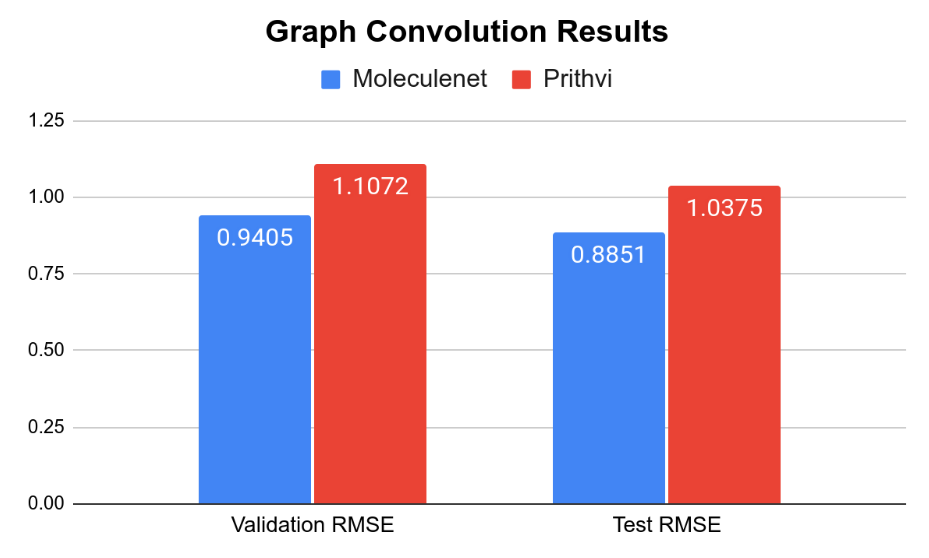
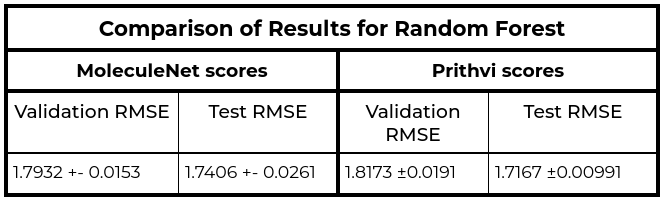
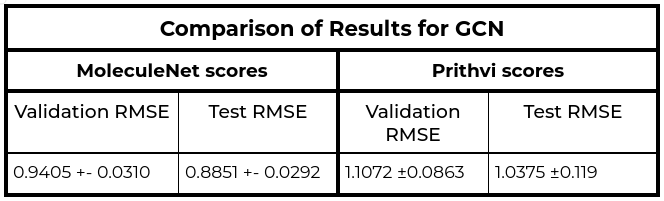
We observe that results for Random Forest models are similar to MoleculeNet numbers while the Graph Convolutional Network models do slightly worse. More systematic hyperparameter tuning should be able to close the gap for the graph convolution models.
Conclusion and Takeaways
Building good models that predict molecular properties can be valuable tools for designing new small molecules. Our Prithvi platform provides systematic infrastructure to build and test chemoinformatic machine learning models all through our easy no-code UI. Enabling chemists and biologists to build strong predictive models without having to write extensive python scripts unlocks the door to systematically leveraging ML and AI in the drug discovery process. In future blog posts in this series, we will explore how Prithvi can be used to build state-of-art models that can help scientists design new molecules that they would not have discovered otherwise.
About Deep Forest Sciences
Deep Forest Sciences’ AI-powered Prithvi toolchain accelerates small-molecule drug discovery efforts. Deep Forest Sciences also leads the development of open-source DeepChem framework, and emphasizes supporting open source and open science as fundamental parts of our mission and values. Partner with us to apply our foundational AI technologies to hard real-world problems in small molecule drug discovery.
Email us at partnerships@deepforestsci.com